Accessing Service from Python
Data drift occurs when a machine model’s performance declines or is different on unseen data compared to its training data due distribution changes in the data over time. In this notebook, we explore and visualize data drift on a simple XGBoost model, that predicts credit card acceptance based on an applicant’s age, credit score, years of education, and years in employment. This tutorial is a counterpart to the data drift monitoring tutorial.
Prerequisites
Follow the instructions within the Installing Open Data Hub section. Additionally, follow the instructions in the Deploy Model section in the Data Drift tutorial. Before proceeding, check that you have the following:
-
ODH installation
-
A TrustyAI Operator
-
A model-namespace project containing an instance of the TrustyAI Service
-
A model storage container
-
A Seldon MLServer serving runtime
-
The delpoyed credit model
Imports
import os
import subprocess
import warnings
warnings.filterwarnings("ignore")

import matplotlib.pyplot as plt

from trustyai.utils.api.api import TrustyAIApi
from trustyai.utils.extras.metrics_service import TrustyAIMetricsService
Clone the Data Drift Repository
For the purposes of recreating the data drift demo, we will be reusing the data in that repository.
git clone https://github.com/trustyai-explainability/odh-trustyai-demos.git
cd odh-trustyai-demos/3-DataDrift
Initialize Metrics Service
In order to use the metrics service, we first have to initialize it using our OpenShift login token and model namespace.
TOKEN = os.environ.get("TOKEN", "None")
trustyService = TrustyAIMetricsService(
    token = TOKEN,
    namespace="model-namespace",
    verify=False
)
Upload Model Training Data To TrustyAI
trustyService.upload_payload_data(
    json_file="data/training_data.json"
)
Label Data Fields
name_mapping = {
    "modelId": "gaussian-credit-model",
    "inputMapping":
      {
        "credit_inputs-0": "Age",
        "credit_inputs-1": "Credit Score",
        "credit_inputs-2": "Years of Education",
        "credit_inputs-3": "Years of Employment"
      },
    "outputMapping": {
      "predict-0": "Acceptance Probability"
    }
}

trustyService.label_data_fields(payload=name_mapping)
Examining TrustyAI’s Model Metadata
trustyService.get_model_metadata()[{'metrics': {'scheduledMetadata': {'metricCounts': {}}},
'data': {'inputSchema': {'items': {'credit_inputs-2': {'type': 'DOUBLE',
'name': 'credit_inputs-2',
'values': None,
'index': 2},
'credit_inputs-3': {'type': 'DOUBLE',
'name': 'credit_inputs-3',
'values': None,
'index': 3},
'credit_inputs-0': {'type': 'DOUBLE',
'name': 'credit_inputs-0',
'values': None,
'index': 0},
'credit_inputs-1': {'type': 'DOUBLE',
'name': 'credit_inputs-1',
'values': None,
'index': 1}},
'remapCount': 2,
'nameMapping': {'credit_inputs-0': 'Age',
'credit_inputs-1': 'Credit Score',
'credit_inputs-2': 'Years of Education',
'credit_inputs-3': 'Years of Employment'},
'nameMappedItems': {'Years of Education': {'type': 'DOUBLE',
'name': 'credit_inputs-2',
'values': None,
'index': 2},
'Age': {'type': 'DOUBLE',
'name': 'credit_inputs-0',
'values': None,
'index': 0},
'Years of Employment': {'type': 'DOUBLE',
'name': 'credit_inputs-3',
'values': None,
'index': 3},
'Credit Score': {'type': 'DOUBLE',
'name': 'credit_inputs-1',
'values': None,
'index': 1}}},
'outputSchema': {'items': {'predict-0': {'type': 'FLOAT',
'name': 'predict-0',
'values': None,
'index': 4}},
'remapCount': 2,
'nameMapping': {'predict-0': 'Acceptance Probability'},
'nameMappedItems': {'Acceptance Probability': {'type': 'FLOAT',
'name': 'predict-0',
'values': None,
'index': 4}}},
'observations': 1000,
'modelId': 'gaussian-credit-model'}}Register Drift Monitoring
drift_monitoring = {
    "modelId": "gaussian-credit-model",
    "referenceTag": "TRAINING"
}
trustyService.get_metric_request(
    payload=drift_monitoring,
    metric="drift/meanshift", reoccuring=True
)'{"requestId":"709174f5-a3f4-4ae9-8f7e-a56b708836ff","timestamp":"2024-03-06T14:23:17.740+00:00"}'Check the Metrics
Let’s get the meanshift values for the training data we just uploaded to the TrustyAI service for the past 5 minutes.
train_df = trustyService.get_metric_data(
    metric="trustyai_meanshift",
    time_interval="[5m]"
)
display(train_df.head())| timestamp | Age | Credit Score | Years of Education | Years of Employment |
|---|---|---|---|---|
2024-03-06 09:23:18 |
1.0 |
1.0 |
1.0 |
1.0 |
2024-03-06 09:23:22 |
1.0 |
1.0 |
1.0 |
1.0 |
2024-03-06 09:23:26 |
1.0 |
1.0 |
1.0 |
1.0 |
2024-03-06 09:23:30 |
1.0 |
1.0 |
1.0 |
1.0 |
2024-03-06 09:23:34 |
1.0 |
1.0 |
1.0 |
1.0 |
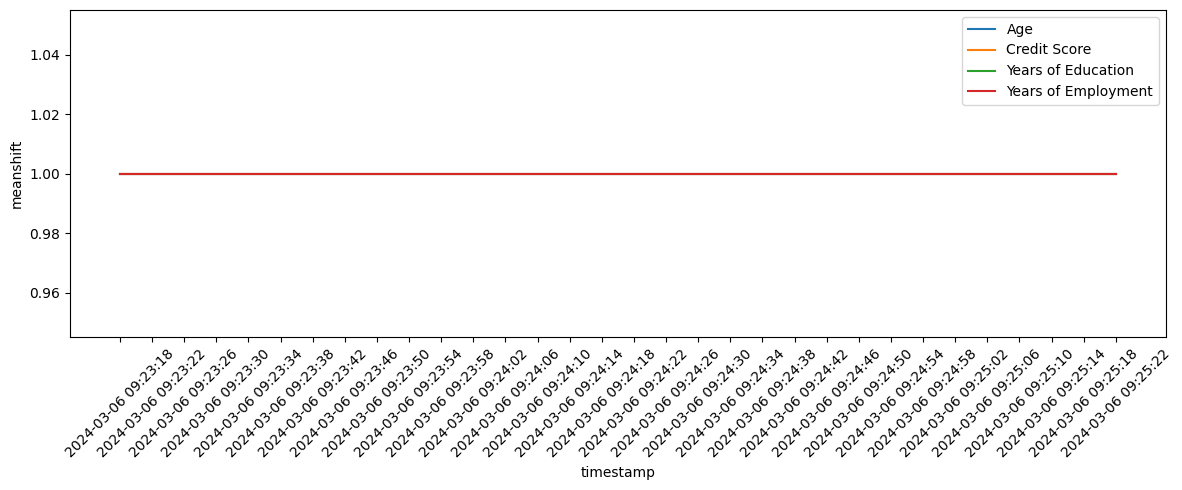
Let’s also visualize the meanshift in a plot similar to the one displayed in ODH Observe → Metrics tab. We will define a helper function so that we can use it again for the unseen data.
def plot_meanshift(df):
    """
    :param df: A pandas DataFrame returned by the TrustyAIMetricsService().get_metric_request
               function with columns corresponding to the timestamp and name of the metric
    returns a scatterplot with the timestamp on the x-axis and the specific metric on the y-axis
    """
    plt.figure(figsize=(12,5))
    for col in df.columns[1:]:
        plt.plot(
            df["timestamp"],
            df[col]
        )
    plt.xlabel("timestamp")
    plt.ylabel("meanshift")
    plt.xticks(rotation=45)
    plt.legend(df.columns[1:])
    plt.tight_layout()
    plt.show()

plot_meanshift(train_df)
Collect "Real-World" Inferences
model_name = "gaussian-credit-model"
model_route = TrustyAIApi().get_service_route(
    name=model_name,
    namespace=trustyService.namespace
)

for batch in list(range(0, 596, 5)):
    trustyService.upload_data_to_model(
        model_route=f"{model_route}/v2/models/gaussian-credit-model",
        json_file=f"data/data_batches/{batch}.json"
    )
Observe Drift
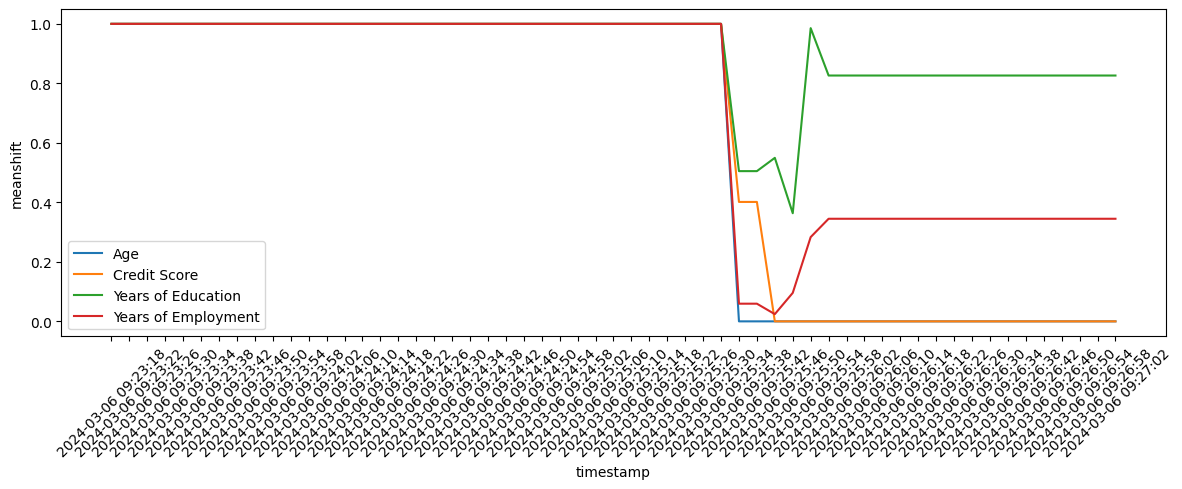
Let’s check if our model is behaving differently on the unseen data.
test_df = trustyService.get_metric_data(
    metric="trustyai_meanshift",
    time_interval="[5m]"
    )
display(test_df.head())| timestamp | Age | Credit Score | Years of Education | Years of Employment |
|---|---|---|---|---|
2024-03-06 09:23:18 |
1.0 |
1.0 |
1.0 |
1.0 |
2024-03-06 09:23:22 |
1.0 |
1.0 |
1.0 |
1.0 |
2024-03-06 09:23:26 |
1.0 |
1.0 |
1.0 |
1.0 |
2024-03-06 09:23:30 |
1.0 |
1.0 |
1.0 |
1.0 |
2024-03-06 09:23:34 |
1.0 |
1.0 |
1.0 |
1.0 |
plot_meanshift(test_df)
As observed, the meanshift values for each of the features have changed drastically from the training to test data, dropping below 1.0. In particular, Age and Credit Score are significantly different according to a p-value of 0.05. Thus, it is clear that our model suffers from data drift.