Data Drift Monitoring
Context
In this example, we’ll be deploying a simple XGBoost model, that predicts credit card acceptance based on an applicant’s age, credit score, years of education, and years in employment. We’ll deploy this model into an Open Data Hub cluster, although this example could also be applied to OpenShift AI as well.
Once the model is deployed, we’ll use the Mean-Shift metric to monitor the data drift. Mean-Shift compares a numeric test dataset against a numeric training dataset, and produces a P-Value measuring the probability that the test data came from the same numeric distribution as the training data. A p-value of 1.0 indicates a very high likelihood that the test and training data come from the same distribution, while a p-value < 0.05 indicates a statistically significant drift between the two. As a caveat, Mean-Shift performs best when each feature in the data is normally distributed, and other metrics would be better suited for different or unknown data distributions.
Setup
Follow the instructions within the Installing on Open Data Hub page. Afterwards,
you should have an ODH installation, a TrustyAI Operator, and a model-namespace project containing
an instance of the TrustyAI Service.
Once the installation is completed, navigate to the Data Drift directory within the demo repository that was downloaded during the Installation Tutorial:
cd odh-trustyai-demos/3-DataDrift|
All future commands within this tutorial should be run from this directory. |
Deploy Model
-
Navigate to the
model-namespacecreated in the setup section:oc project model-namespace -
Deploy the model’s storage container:
oc apply -f resources/model_storage_container -
Deploy the Seldon MLServer serving runtime:
oc apply -f resources/odh-mlserver-1.x.yaml -
Deploy the credit model:
oc apply -f resources/model_guassian_credit.yaml -
From the OpenShift Console, navigate to the
model-namespaceproject and look at the Workloads → Pods screen.-
You should see at least four pods named
modelmesh-serving-mlserver—1.x-xxxxx -
Once the TrustyAI Service registers the deployed models, you will see the ` modelmesh-serving-mlserver—1.x-xxxxx` pods get re-deployed.
-
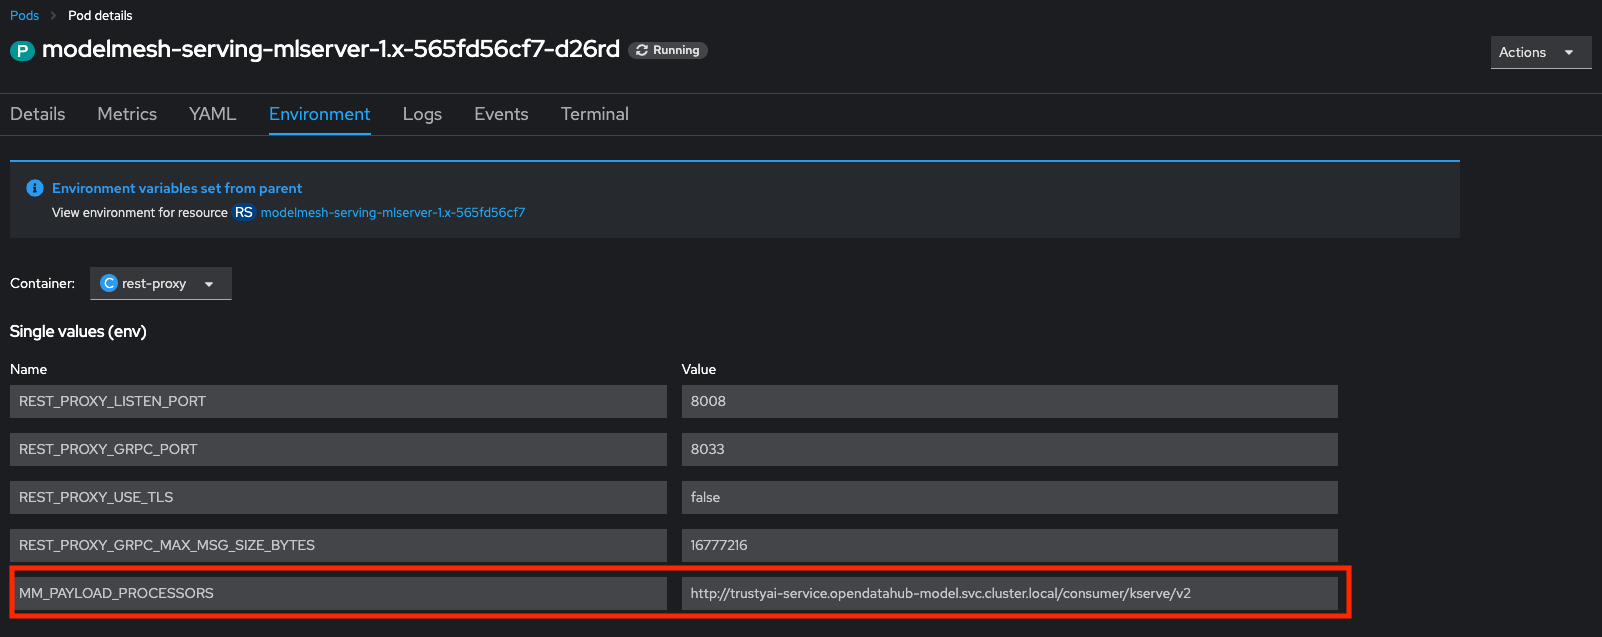
Verify that the models are registered with TrustyAI by selecting one of the
modelmesh-serving-ovms-1.x-xxxxxpods. In the Environment tab, if the fieldMM_PAYLOAD_PROCESSORSis set, then your models are successfully registered with TrustyAI:
-
Upload Model Training Data To TrustyAI
|
Endpoint authentication
A TrustyAI’s service external endpoints will only be accessible to authenticated users. Instruction on to access them are available in the External endpoints section. |
First, we’ll get the route to the TrustyAI service in our project:
TRUSTY_ROUTE=https://$(oc get route/trustyai-service --template={{.spec.host}})Next, we’ll send our training data to the /data/upload endpoint
curl -sk $TRUSTY_ROUTE/data/upload  \
  --header 'Authorization: Bearer ${TOKEN}' \
  --header 'Content-Type: application/json' \
  -d @data/training_data.json
You should see the message 1000 datapoints successfully added to gaussian-credit-model data.
The Data Upload Payload
The data upload payload (an example of which is seen in training_data.json contains four main fields:
-
model_name: The name of the model to correlate this data with. This should match the name of the model we provided in the model yaml, in this casegaussian-credit-modelapiVersion: serving.kserve.io/v1beta1 kind: InferenceService metadata: name: gaussian-credit-model annotations: serving.kserve.io/deploymentMode: ModelMesh spec: predictor: model: modelFormat: name: xgboost runtime: mlserver-1.x storage: key: aws-connection-minio-data-connection path: sklearn/gaussian_credit_model.json -
data_tag: A string tag to reference this particular set of data. Here, we choose"TRAINING" -
request: A KServe Inference Request, as if you were sending this data directly to the model server’s/inferendpoint. -
response: (Optionally) the KServe Inference Response that is returned from sending the above request to the model.
Examining TrustyAI’s Model Metadata
We can verify that TrustyAI has received the data via /info endpoint:
-
Query the
/infoendpoint:curl -H 'Authorization: Bearer ${TOKEN}' \ $TRUSTY_ROUTE/info | jq ".[0].data"This will output a json file containing the following information for the model:
-
The names, data types, and positions of fields in the input and output
-
The observed values that these fields take (likely
nullin this case, indicating that there are too many unique feature values to merit enumerating) -
The total number of input-output pairs observed, in our case, should be
1000
-
Label Data Fields
As you can see, the models does not provide particularly useful field names for our inputs and outputs (all some form of credit_inputs-x). We can apply a set of name mappings to these to apply meaningful names to the fields. This is done via POST’ing the /info/names endpoint:
curl -sk -H 'Authorization: Bearer ${TOKEN}' \
  -X POST --location $TRUSTY_ROUTE/info/names \
  -H "Content-Type: application/json"   \
  -d "{
    \"modelId\": \"gaussian-credit-model\",
    \"inputMapping\":
      {
        \"credit_inputs-0\": \"Age\",
        \"credit_inputs-1\": \"Credit Score\",
        \"credit_inputs-2\": \"Years of Education\",
        \"credit_inputs-3\": \"Years of Employment\"
      },
    \"outputMapping\": {
      \"predict-0\": \"Acceptance Probability\"
    }
  }"
You should see the message Feature and output name mapping successfully applied.
The payload of the request is a simple set of original-name : new-name pairs, assigning new meaningful names to the input and output
features of our model.
Register the Drift Monitoring
To schedule a recurring drift monitoring metric, we’ll POST the /metrics/drift/meanshift/request
curl -k -H 'Authorization: Bearer ${TOKEN}' \
  -X POST --location $TRUSTY_ROUTE/metrics/drift/meanshift/request -H "Content-Type: application/json" \
  -d "{
        \"modelId\": \"gaussian-credit-model\",
        \"referenceTag\": \"TRAINING\"
      }"
The body of the payload is quite simple, requiring a modelId to set the model to monitor and a referenceTag that
determines which data to use as the reference distribution, in our case TRAINING to match the tag we used when we uploaded the training
data. This will then measure the drift of all recorded inference data against
the reference distribution.
Check the Metrics
-
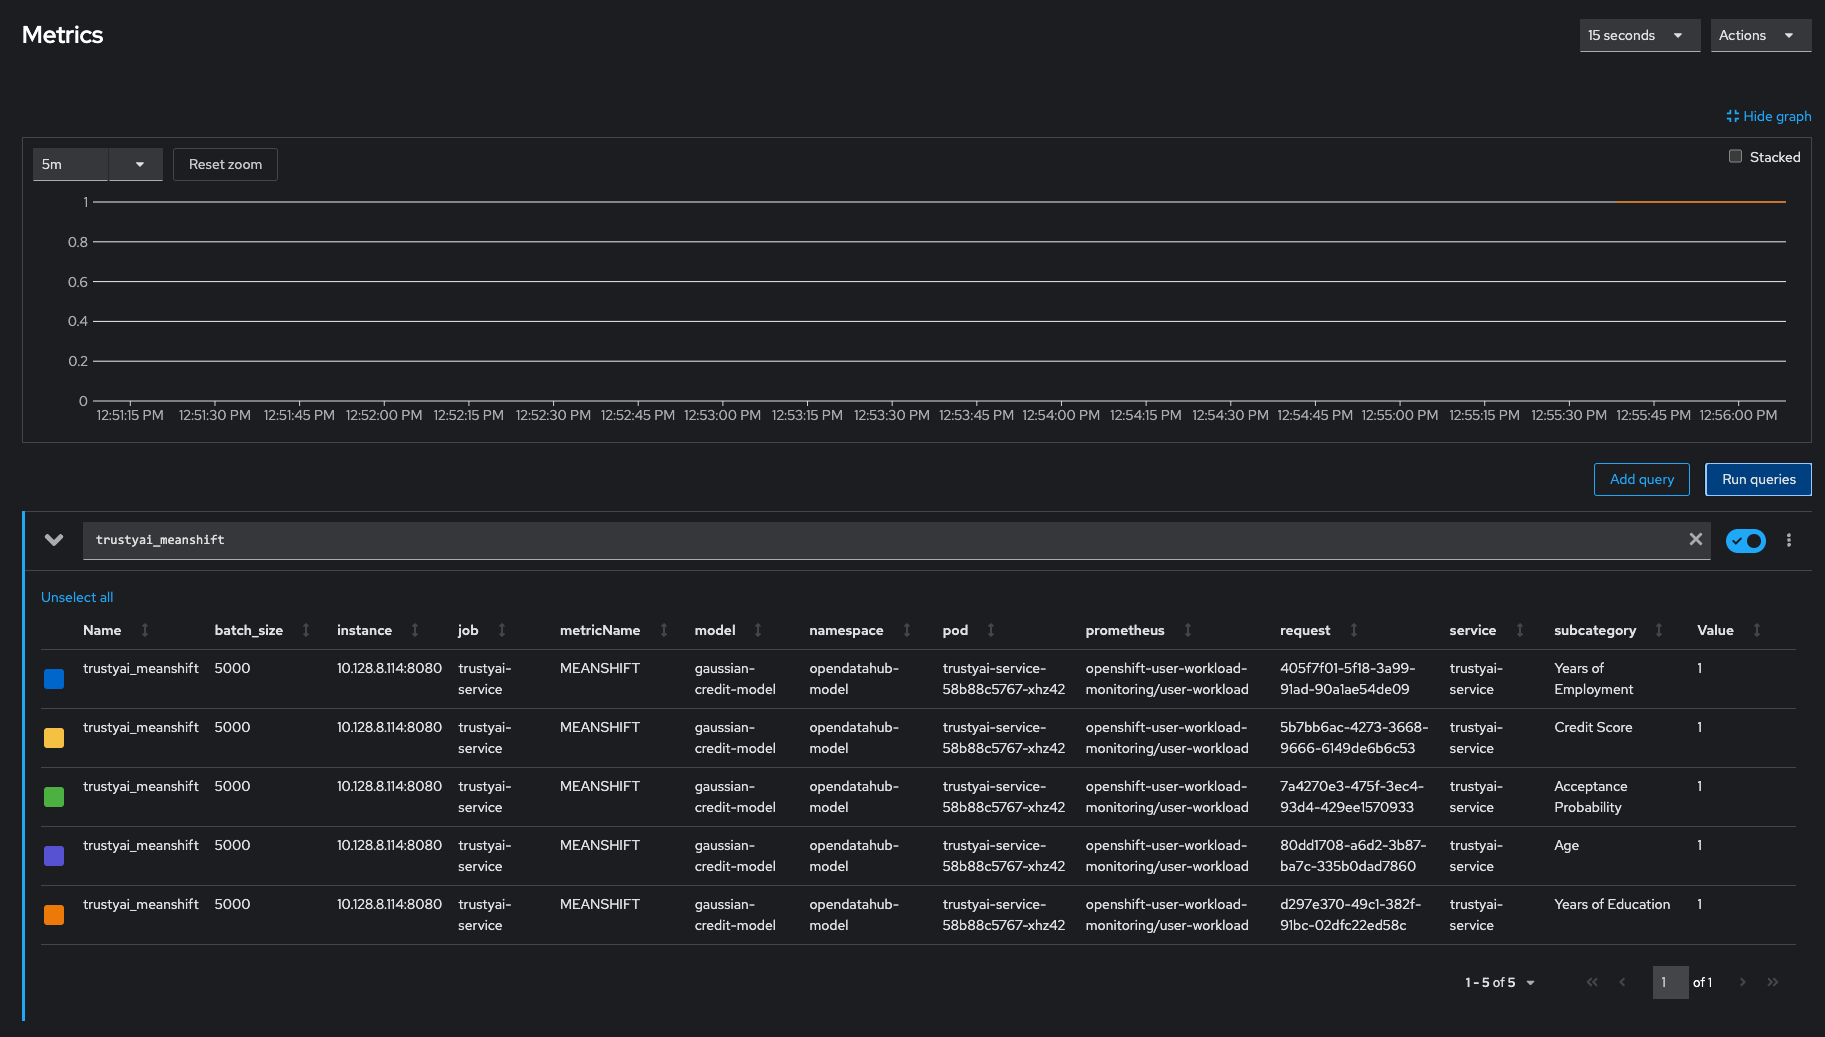
Navigate to Observe → Metrics in the OpenShift console. If you’re already on that page, you may need to refresh before the new metrics appear in the suggested expressions.
-
Set the time window to 5 minutes (top left) and the refresh interval to 15 seconds (top right)
-
In the "Expression" field, enter
trustyai_meanshift. It might take a few seconds before the cluster monitoring stacks picks up the new metric, so iftrustyai_meanshiftis not appearing, try refreshing the page. -
Explore the Metric Chart:

-
You’ll notice that a metric is emitted for each of the four features and the single output, making for five measurements in total. All metric values should equal 1 (no drift), which makes sense: we only have the training data, which can’t drift from itself.
Collect "Real-World" Inferences
-
Get the route to the model:
MODEL_ROUTE=https://$(oc get route/gaussian-credit-model --template={{.spec.host}}) -
Send data payloads to model:
for batch in {0..595..5}; do
  curl -k $MODEL_ROUTE/v2/models/gaussian-credit-model/infer -d @data/data_batches/$batch.json
  sleep 1
done
Observe Drift

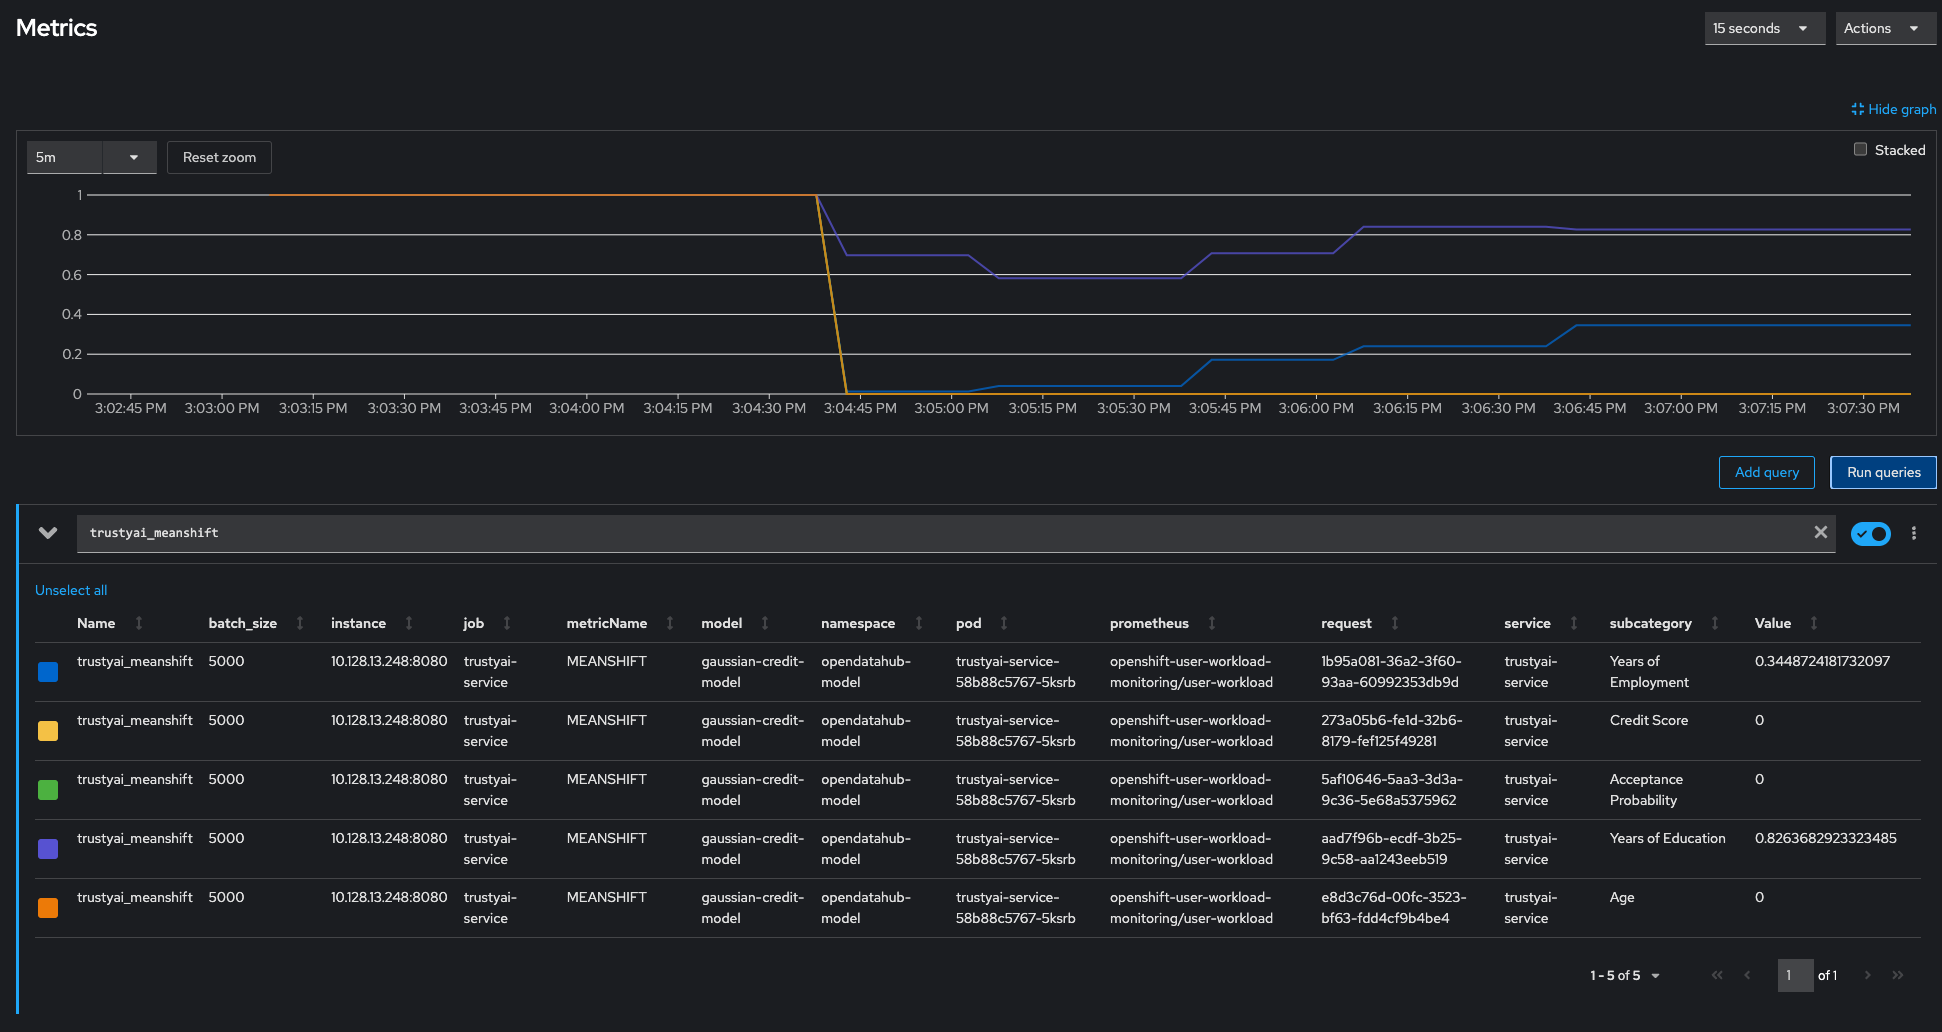
Navigating back to the Observe → Metrics page in the OpenShift console, we can see the MeanShift metric
values for the various features changes. Notably, the values for Credit Score, Age, and Acceptance Probability have all dropped to 0, indicating there is a statistically very high likelihood that the values of these fields in the inference data come from a different distribution than that of the training data. Meanwhile, the Years of Employment and Years of Education scores have dropped to 0.34 and 0.82 respectively, indicating that there is a little drift, but not enough to be particularly concerning. Remember, the Mean-Shift metric scores are p-values, so only values < 0.05 indicate statistical significance.
A Peek Behind The Curtain
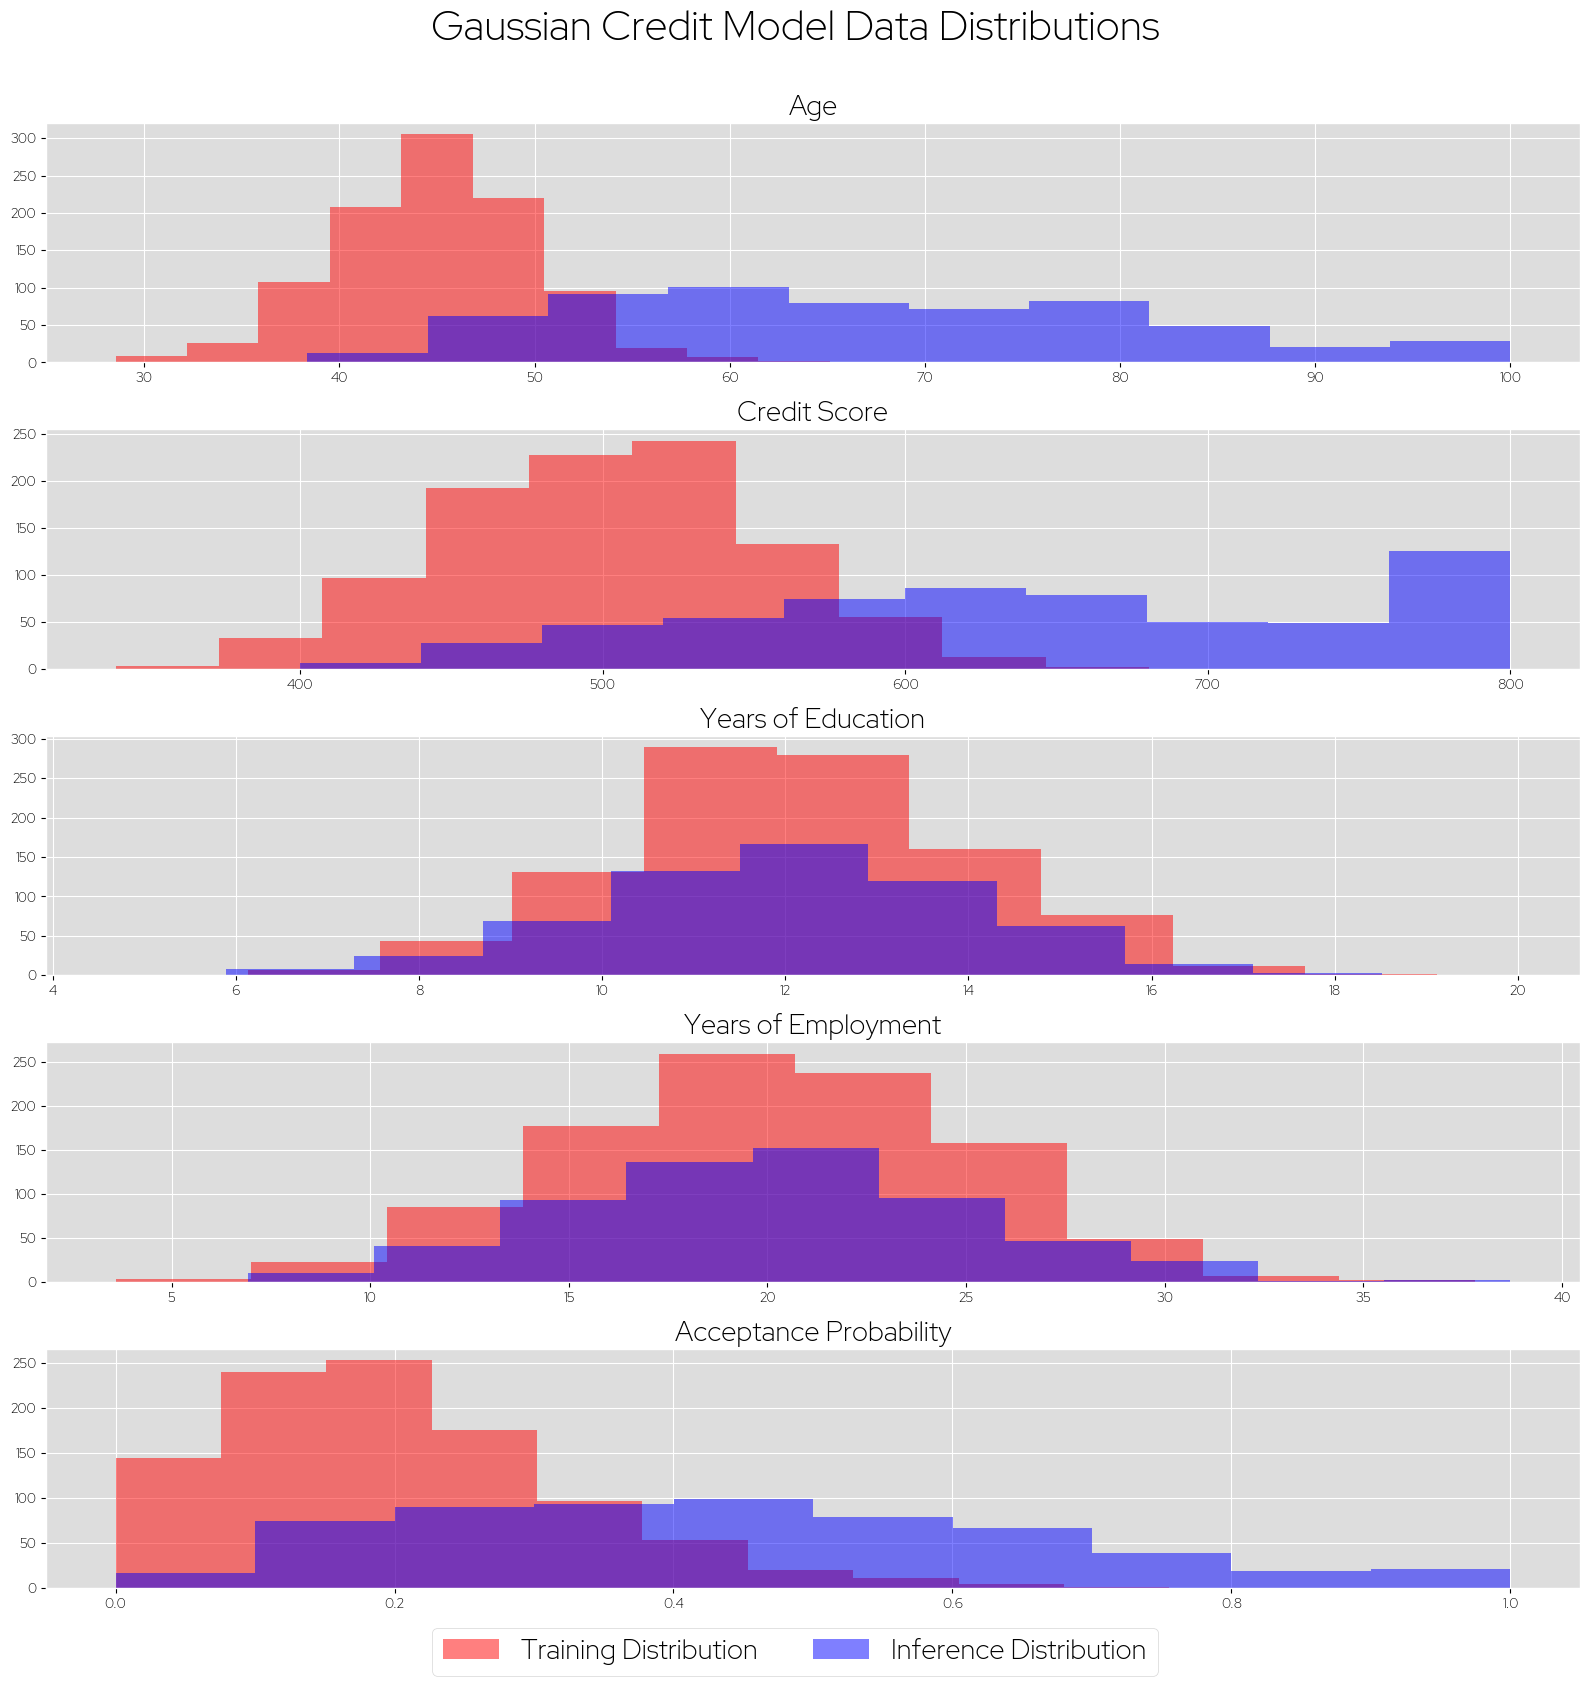
To better understand the what these metrics tell us, let’s take a look behind the curtain at the actual data I generated for this example, and look at the real distributions of the training and inference datasets:

In red are each features' distributions in the training set, while the blue shows the distribution
seen in the "real-world" inference data. We can clearly see that the Age and Credit Score data
are drawn from two different distributions, while Years of Education and Years of Employment look
to be the same distribution, and this exactly aligns with the metric values we observed in the previous section. Naturally, the differing input distributions also cause the output Acceptance Probability distribution to shift as well.
Conclusion
The Mean-Shift metric, as well as the more complex FourierMMD and Kolmogorov-Smirnov metrics, are excellent tools to understand how well your models understand the real-life deployment data that they are receiving. It is crucially important to monitor data drift, as ensuring that the training and inference data are closely aligned gives your models the best chance at performing well in the real-world. After all, it does not matter if your models are impeccable over the training data: it is only when they are deployed to real users that these models provide any meaningful value, and it is only during this deployment that their performance actually matters, where these models might begin to affect your user’s lives and livelihoods. Using TrustyAI to monitor the data drift can help you trust that your models are operating in familiar territory and that they can accurately apply all the intuitions they learned during training.